

The Extraordinary Value of a Demonstrated Production Outcome
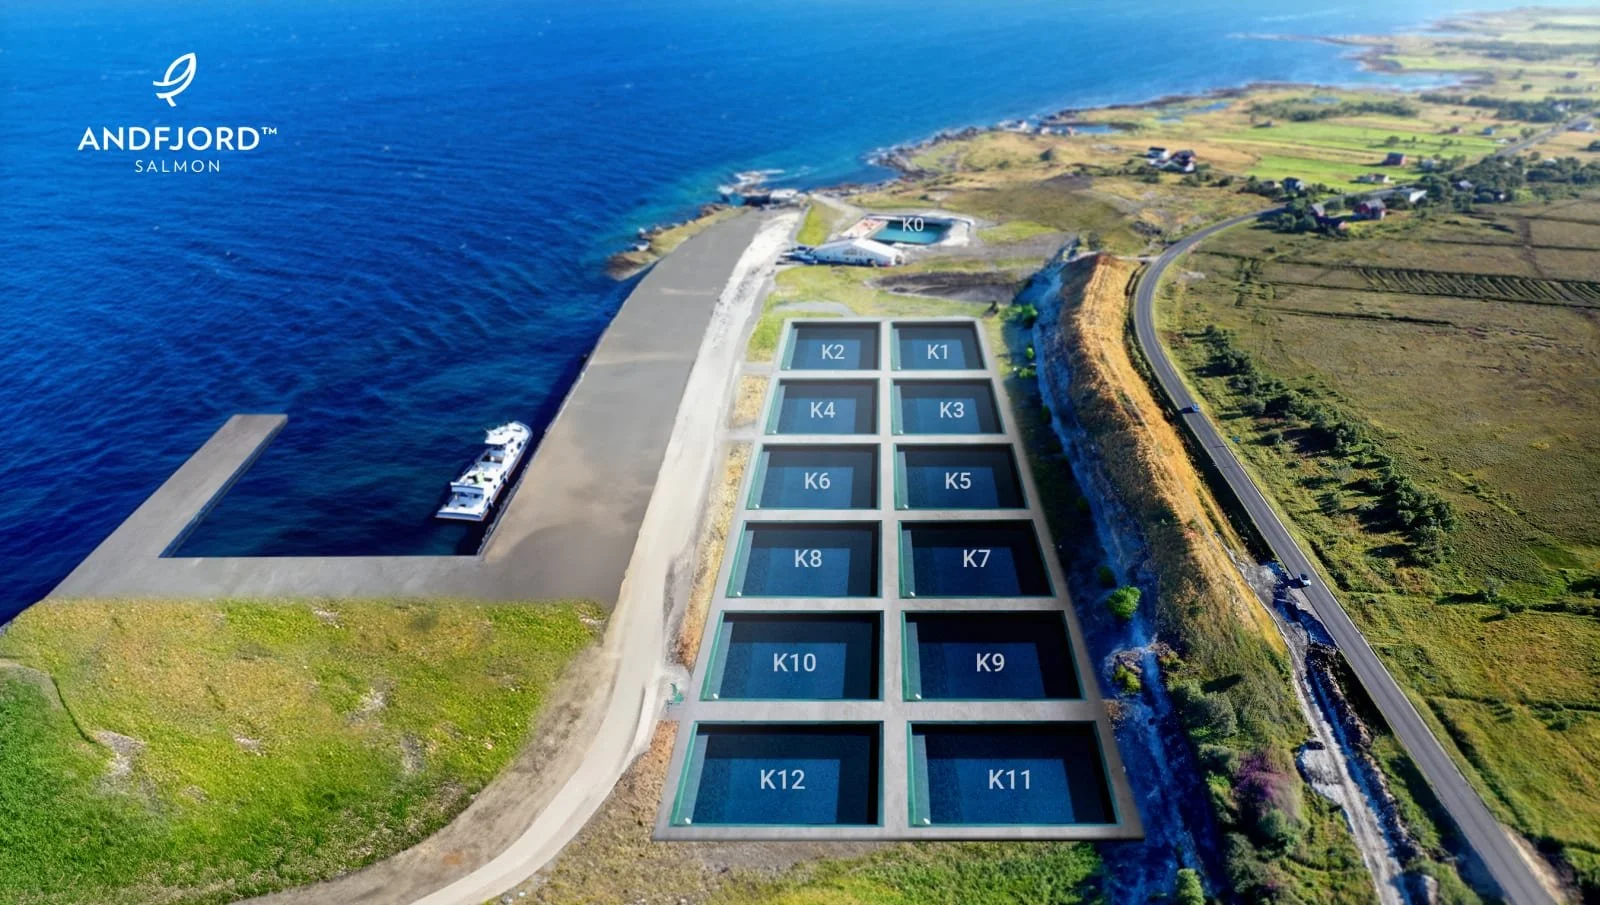
Image by Andfjord Salmon
There was a small but unusually interesting comment in Andfjord Salmon’s latest production update.
In June, Andfjord removed around 450,000 fish from its K1 pool for sale as post-smolt, leaving approximately 290,000 fish to continue to harvest. Based on reported biomass and pool volume, density fell from roughly 43 kg/m³ immediately before the sale to around 17 kg/m³ afterwards. By the end of September, the remaining fish averaged 3.485 kg, up from 1.325 kg at the end of June.
CEO Martin Rasmussen described what happened next as a “hockey stick effect” after the reduction in biomass density. It would be easy to read that as simply another positive biological update.
I think it tells us considerably more.
The interesting question is not just whether the fish grew faster after density was reduced. It is what that growth response tells us about the assumptions underlying Andfjord’s long-term production model.
The result behind the result
Andfjord has historically been relatively conservative about stocking density, generally planning around densities below those proposed by some competing land-based systems.
The latest result provides some support for that philosophy. It does not establish 40 or 45 kg/m³ as a universal limit for Atlantic salmon, nor can the improvement in K1 be attributed entirely to density. Fish size, temperature, daylight and operating conditions were also changing.
But something important happened when biomass was removed: the remaining fish grew extraordinarily well.
A demonstrated production outcome
Before a new facility operates at commercial scale, expected production is necessarily modelled. Tank volume, stocking density, growth rate, feed conversion, mortality, harvest weight and cycle duration are combined to calculate annual capacity. The challenge is that those assumptions may never have been demonstrated together, in that particular facility, at commercial biomass and with harvest-sized fish.
That is where operating results become particularly valuable.
Andfjord provides one example.
The company has assumed relatively conservative biomass densities. When K1 was heavily thinned, the subsequent growth response was exceptionally strong. That does not prove Andfjord’s eventual production targets, but it is a demonstrated production outcome broadly consistent with the idea that strong growth and turnover can compensate for operating at lower density.
When the result points the other way
Atlantic Sapphire provides an instructive contrast.
For years, low harvest weights could easily have been viewed as another disappointing KPI during a difficult ramp-up. But the more important question was what those harvest weights were telling us about the production system.
In 2024, Atlantic Sapphire acknowledged that water quality and system performance indicated that the facility had reached peak capacity. Feeding had to be constrained and fish were harvested early, at small weights, to reduce biomass and allow the remaining fish to grow.
That is much more informative than simply knowing that average harvest weight was below plan.
The production model required the facility to support enough biomass, for long enough, to grow fish to larger harvest weights. The demonstrated outcome was that increasing biomass eventually constrained feeding and growth sufficiently that fish had to be removed early.
Atlantic Sapphire has since invested in removing those bottlenecks and performance has improved. But the original productive capacity had not been demonstrated by the as-built system.
Reached, or demonstrated?
This distinction matters when looking at capacity utilisation.
Imagine two plants designed to produce 10,000 tonnes per year, each currently producing 6,000 tonnes.
In the first, fish are growing according to plan. FCR, survival, harvest weight and cycle duration are where they should be. Additional production simply remains to be added as the operation ramps. Its remaining 4,000 tons may reasonably be regarded as capacity yet to be reached.
In the second, growth slows as biomass increases. Fish are harvested below target weight to protect water quality or feeding capacity. Achieving the additional tons requires biological performance the system has not yet produced.
Its remaining 4,000 tons are capacity not yet demonstrated.
Those situations can look very similar in a conventional capacity-utilization table. From an investment perspective, they are very different.
Reading the biological footnotes
The most useful information in a production update is not always the number management chooses to headline.
An unusual growth response, falling harvest weight, a change in stocking strategy, improved performance after reducing biomass, deteriorating FCR or early harvesting may contain more information about future productive capacity than the quarterly tons themselves.
The useful sequence is simple:
What happened?
Why?
And what does that outcome tell us about an assumption in the long-term production model?
Andfjord’s “hockey stick” comment is interesting because it is more than a favourable biological observation. It provides another piece of evidence that its relatively conservative density assumptions may make sense.
Atlantic Sapphire’s experience provided the opposite signal. Persistently low harvest weights eventually revealed that the facility could not support the planned biomass and feeding levels without further investment.
Neither observation tells us everything about either company. But both show why investors should distinguish between capacity that has been calculated, capacity that has been built and capacity that has actually been demonstrated.
In an established production system, those numbers may eventually converge.
In an unproven one, the gap between them is where much of the investment risk resides.